Estimation of PV Stand-alone System electricity generation for the chosen location
Inclination of modules: 35 deg.
Battery size : 12 V, 500 Ah
Discharge cutoff limit (%) 40 %
Consumption per day: 972 Wh
| Number of days used for the calculation: | 1801 |
| Percentage of days with fully charged battery | 43% |
| Average energy not captured due to full battery: | 903Wh/day |
| Percentage of days the battery became fully discharged: | 19% |
| Average energy missing: | 497Wh/day |
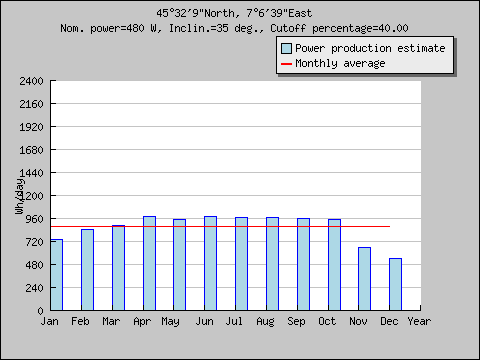
The graph and table below show the (estimated) daily amount of electric power you can expect in each month from a Solar Home PV system with the properties you entered. It also shows the yearly average production per day.
| Month | Ed | Ff | Fe |
|---|---|---|---|
| Jan | 737.0 | 4 | 49 |
| Feb | 850.0 | 24 | 26 |
| Mar | 887.0 | 26 | 19 |
| Apr | 979.0 | 40 | 13 |
| May | 948.0 | 47 | 8 |
| Jun | 983.0 | 61 | 7 |
| Jul | 972.0 | 92 | 0 |
| Aug | 971.0 | 79 | 0 |
| Sep | 959.0 | 70 | 0 |
| Oct | 954.0 | 53 | 0 |
| Nov | 659.0 | 9 | 48 |
| Dec | 542.0 | 0 | 69 |
| Year | 873.5 | ||
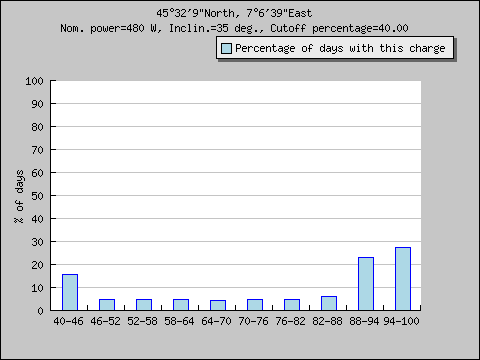
| Cs | Cb |
|---|---|
| 40-46 | 15 |
| 46-52 | 4 |
| 52-58 | 4 |
| 58-64 | 4 |
| 64-70 | 4 |
| 70-76 | 4 |
| 76-82 | 4 |
| 82-88 | 6 |
| 88-94 | 22 |
| 94-100 | 27 |
 ;
;
 ;
;
PVGIS © European Communities, 2001-2012
Reproduction is authorised, provided the source is acknowledged
See the disclaimer
here